Fact Sheet

Spending Increases by Department
Gov. Tom Corbett’s FY 2011-12 budget proposal includes $63.6 billion in total operating spending—$27.3 billion in General Fund spending—a reduction of $3.3 billion from FY 2010-11. This budget restores overall spending to pre-stimulus levels and proposes no new taxes. This is the third in a series of fact sheets on the state budget.
The Budget Maintains Above-inflation Increases in Spending
- The FY 2011-12 budget proposal represents a 36% increase in total General Fund spending (including sales tax revenue shifted to the Public Transportation Trust Fund) since FY 2002-03.
- The proposed budget increases spending over fiscal year 2002-03 by inflation and population growth, plus an additional $1.6 billion.
- The proposed budget increases spending over fiscal year 2002-03 by inflation and population growth, plus an additional $1.6 billion.
- Gov. Corbett’s budget cuts $866 million from FY 2010-11 levels, which included more than $2.7 billion in federal stimulus funds.

Corbett’s Proposal
- Education and Public Welfare are the two largest departments in the state budget, representing 80% of all General Fund spending.
- Education, including K-12 and higher education, is reduced by $1.5 billion under Corbett’s budget.
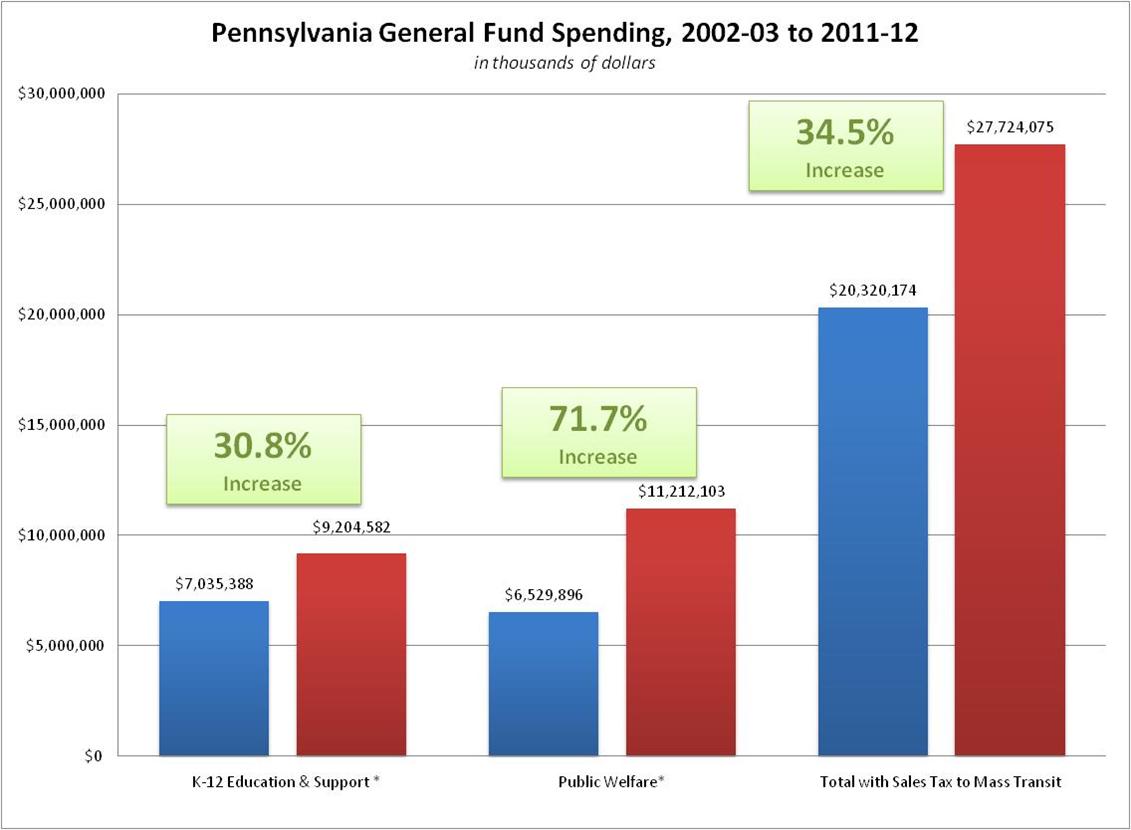
- This still represents a $1.5 billion increase (18%)—including a $2.2 billion increase (31%) in K-12 education—since 2002-03.
- Public Welfare spending would increase by $600 million, primarily in Medical Assistance (Medicaid) with a loss of federal funds and rigid federal rules.
- Having increased 72% since 2002-03, Public Welfare is consuming a greater share of the state budget, and surpassed Education as the largest department for General Fund spending in the proposed budget.
- Treasury, which includes interest payments on debt, is the fastest growing department, at 183% from 2002-03 to 2011-12.
| Pennsylvania General Fund Spending, 2002-03 to 2011-12 | |||||
| in thousands of dollars | |||||
| 2002-03 to 2011-12 | |||||
| Department | 2002-03 | 2010-11 (Available) | 2011-12 (Proposed) | Change in % | Change in $ |
| Governor’s Office | $8,034 | $6,400 | $6,228 | -22.48% | ($1,806) |
| Executive Offices | $327,197 | $168,997 | $158,975 | -51.41% | ($168,222) |
| Lt. Governor’s Office | $927 | $995 | $1,359 | 46.60% | $432 |
| Attorney General | $75,058 | $83,007 | $82,199 | 9.51% | $7,141 |
| Auditor General | $47,634 | $46,245 | $45,075 | -5.37% | ($2,559) |
| Treasury | $393,100 | $1,023,234 | $1,113,193 | 183.18% | $720,093 |
| Agriculture | $74,205 | $93,039 | $87,711 | 18.20% | $13,506 |
| Community & Economic Development | $396,498 | $327,462 | $223,553 | -43.62% | ($172,945) |
| Conservation & Natural Resources | $105,503 | $82,480 | $58,342 | -44.70% | ($47,161) |
| Corrections* | $1,247,059 | $1,867,230 | $1,880,810 | 50.82% | $633,751 |
| Education* | $8,509,157 | $11,511,261 | $10,040,143 | 17.99% | $1,530,986 |
| Higher Ed* | $1,473,769 | $1,491,786 | $835,561 | -43.30% | ($638,208) |
| K-12 Education & Support * | $7,035,388 | $10,019,475 | $9,204,582 | 30.83% | $2,169,194 |
| Environmental Protection | $241,835 | $145,486 | $138,224 | -42.84% | ($103,611) |
| General Services | $112,464 | $120,282 | $120,453 | 7.10% | $7,989 |
| Health | $252,509 | $233,705 | $295,225 | 16.92% | $42,716 |
| Higher Education Assistance Agency | $412,838 | $441,199 | $411,557 | -0.31% | ($1,281) |
| Historical & Museum Commission | $32,801 | $18,467 | $17,881 | -45.49% | ($14,920) |
| Insurance | $57,219 | $121,880 | $121,099 | 111.64% | $63,880 |
| Labor & Industry | $107,066 | $86,200 | $72,269 | -32.50% | ($34,797) |
| Military & Veterans Affairs | $100,992 | $110,334 | $129,992 | 28.72% | $29,000 |
| Probation & Parole Board | $99,369 | $120,578 | $128,115 | 28.93% | $28,746 |
| Public Welfare* | $6,529,896 | $10,604,374 | $11,212,103 | 71.70% | $4,682,207 |
| Revenue | $210,488 | $189,731 | $197,661 | -6.09% | ($12,827) |
| State | $6,744 | $8,496 | $10,242 | 51.87% | $3,498 |
| State Police | $169,830 | $175,568 | $185,578 | 9.27% | $15,748 |
| Transportation** | $315,383 | $389,123 | $395,082 | 25.27% | $79,699 |
| Legislature | $258,100 | $300,285 | $296,012 | 14.69% | $37,912 |
| Judiciary | $235,012 | $276,860 | $276,860 | 17.81% | $41,848 |
| Total with Sales Tax to Mass Transit | $20,320,174 | $28,584,488 | $27,724,075 | 36.44% | $7,403,901 |
| SOURCES: Governor’s Executive Budget, FY 2004-05; FY 2011-12 | |||||
| * Includes federal stimulus funds in 2010-11 totals | |||||
| ** Includes almost $400 million shifted from transportation to mass transit fund. | |||||
# # #
For more information on the Pennsylvania State Budget, visit CommonwealthFoundation.org/Budget.
The Commonwealth Foundation is an independent, non-profit research and educational institute.