Fact Sheet

Public vs. Private Employment & Pay
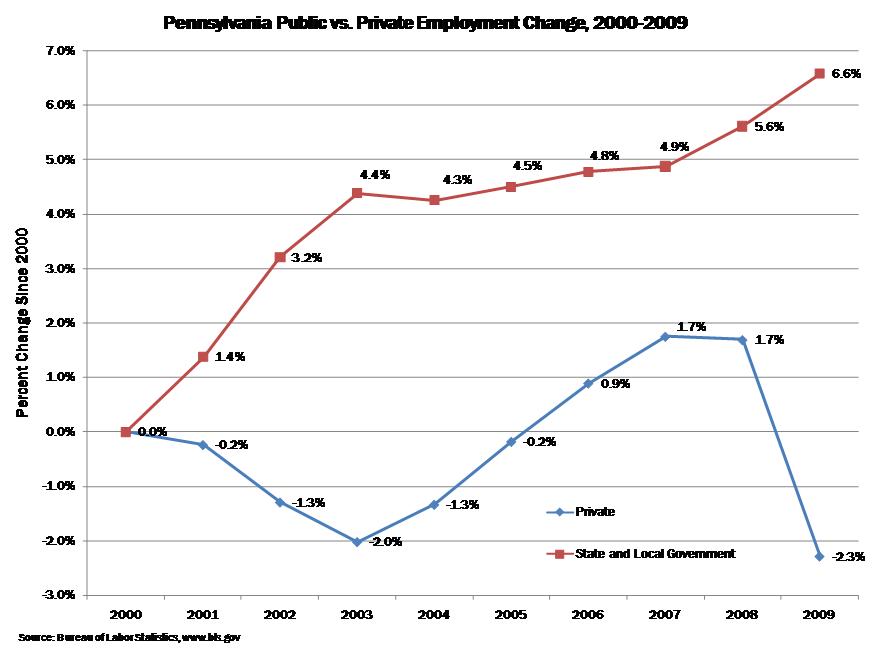
Pennsylvania’s private sector lost 113,600 jobs while state and local governments added 40,200 positions between 2000 and 2009, according to the Bureau of Labor Statistics.

At the same time, public-sector wages exceed those for comparable positions in the private sector.
According to the Bureau of Labor Statistics, Pennsylvania’s public-sector employees are, on average, better paid than private-sector workers in similar occupations in the same geographic area, even before the public sector’s more generous health-care and pension benefits are included.
| Public and Private Sector Mean Hourly Wages, by Occupation | ||||
| Management | ||||
| Pennsylvania | Private Sector | Public Sector (State & Local) |
Percent Difference | Report Date |
| Philadelphia Region | $37.03 | $37.08 | 0.14% | Jan-09 |
| York Area | $29.63 | $33.01 | 11.41% | Oct-08 |
| Pittsburgh Area | $29.84 | $37.02 | 24.06% | Mar-09 |
| Reading Area | $27.14 | $34.83 | 28.33% | Jan-09 |
| Johnstown Area | $22.88 | $26.00 | 13.64% | Jun-09 |
| Service | ||||
| Pennsylvania | Private Sector | Public Sector (State & Local) |
Percent Difference | Report Date |
| Philadelphia Region | $11.56 | $23.37 | 102.16% | Jan-09 |
| York Area | $8.72 | $16.25 | 86.35% | Oct-08 |
| Pittsburgh Area | $9.71 | $19.16 | 97.32% | Mar-09 |
| Reading Area | $10.20 | $15.79 | 54.80% | Jan-09 |
| Johnstown Area | $9.48 | $18.53 | 95.46% | Jun-09 |
| Sales and Office | ||||
| Pennsylvania | Private Sector | Public Sector (State & Local) | Percent Difference | Report Date |
| Philadelphia Region | $16.83 | $19.77 | 17.47% | Jan-09 |
| York Area | $14.08 | $15.05 | 6.89% | Oct-08 |
| Pittsburgh Area | $14.46 | $17.42 | 20.47% | Mar-09 |
| Reading Area | $15.72 | $17.57 | 11.77% | Jan-09 |
| Johnstown Area | $13.62 | $12.34 | -9.40% | Jun-09 |
| Natural Resources, Construction and Maintenance | ||||
| Pennsylvania | Private Sector | Public Sector (State & Local) |
Percent Difference | Report Date |
| Philadelphia Region | $22.18 | $22.35 | 0.77% | Jan-09 |
| York Area | $18.98 | NA | Oct-08 | |
| Pittsburgh Area | $18.59 | $17.86 | -3.93% | Mar-09 |
| Reading Area | $17.23 | $19.01 | 10.33% | Jan-09 |
| Johnstown Area | $19.10 | NA | Jun-09 | |
| Production, Transportation and Material | ||||
| Pennsylvania | Private Sector | Public Sector (State & Local) |
Percent Difference | Report Date |
| Philadelphia Region | $16.72 | $19.86 | 18.78% | Jan-09 |
| York Area | $14.94 | NA | Oct-08 | |
| Pittsburgh Area | $17.57 | $16.21 | -7.74% | Mar-09 |
| Reading Area | $15.65 | NA | Jan-09 | |
| Johnstown Area | $14.56 | NA | Jun-09 | |
| Source: www.bls.gov/ncs/ocs/compub.htm#PA | ||||
# # #
For more on Public Employee Pensions and Benefits visit www.CommonwealthFoundation.org
The Commonwealth Foundation (www.CommonwealthFoundation.org) is an independent, non-profit research and educational institute.