Fact Sheet

Philadelphia School Trends, 2002-03 to 2012-13
The School District of Philadelphia is in desperate need of reform, but its many problems cannot be solved by simply raising taxes and increasing spending. An analysis of the school district over the last decade reveals that revenue and expenditures have increased despite declining enrollment. Although city schools have seen staff reductions, these have been outpaced by a shrinking student population.
Revenue and Spending Have Soared Over the Last Ten Years
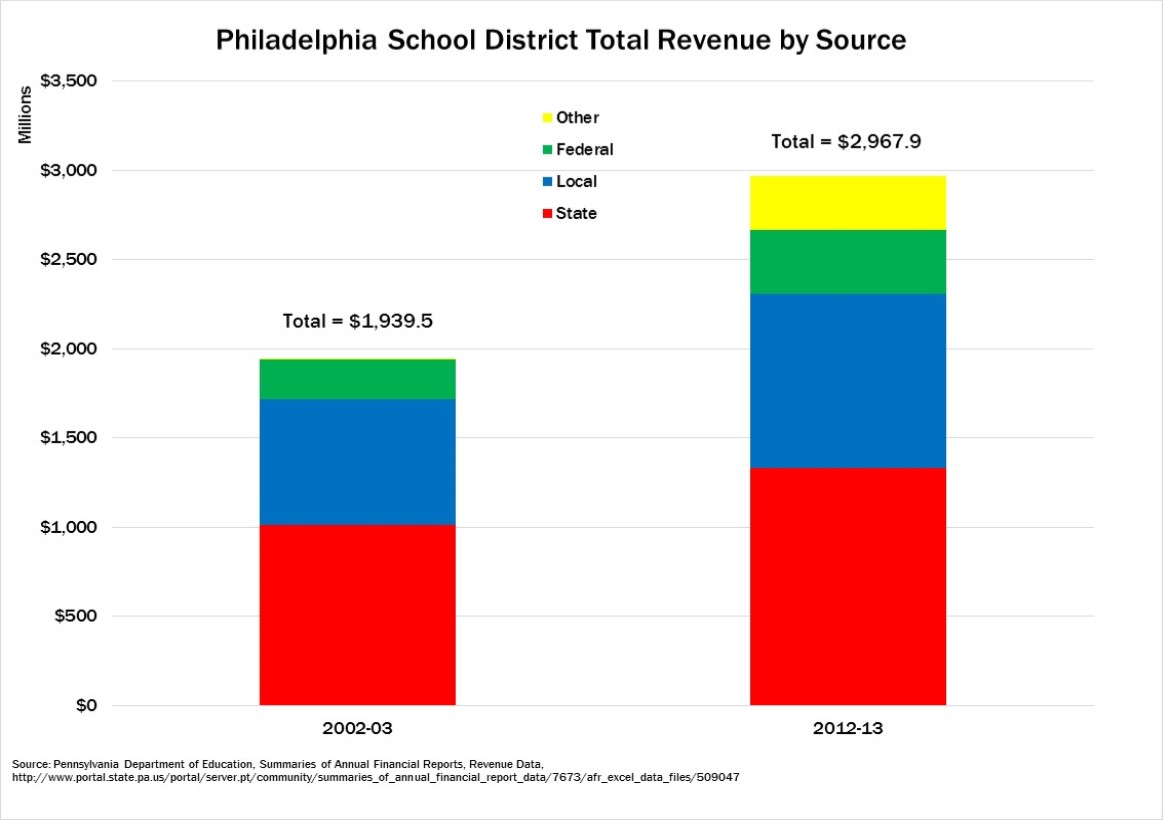
- Since the 2002-2003 school year, revenue increased by more than $1 billion, from $1.94 billion to $2.97 billion.
- Even accounting for inflation, the district has received revenue increases from state, local, and federal sources.
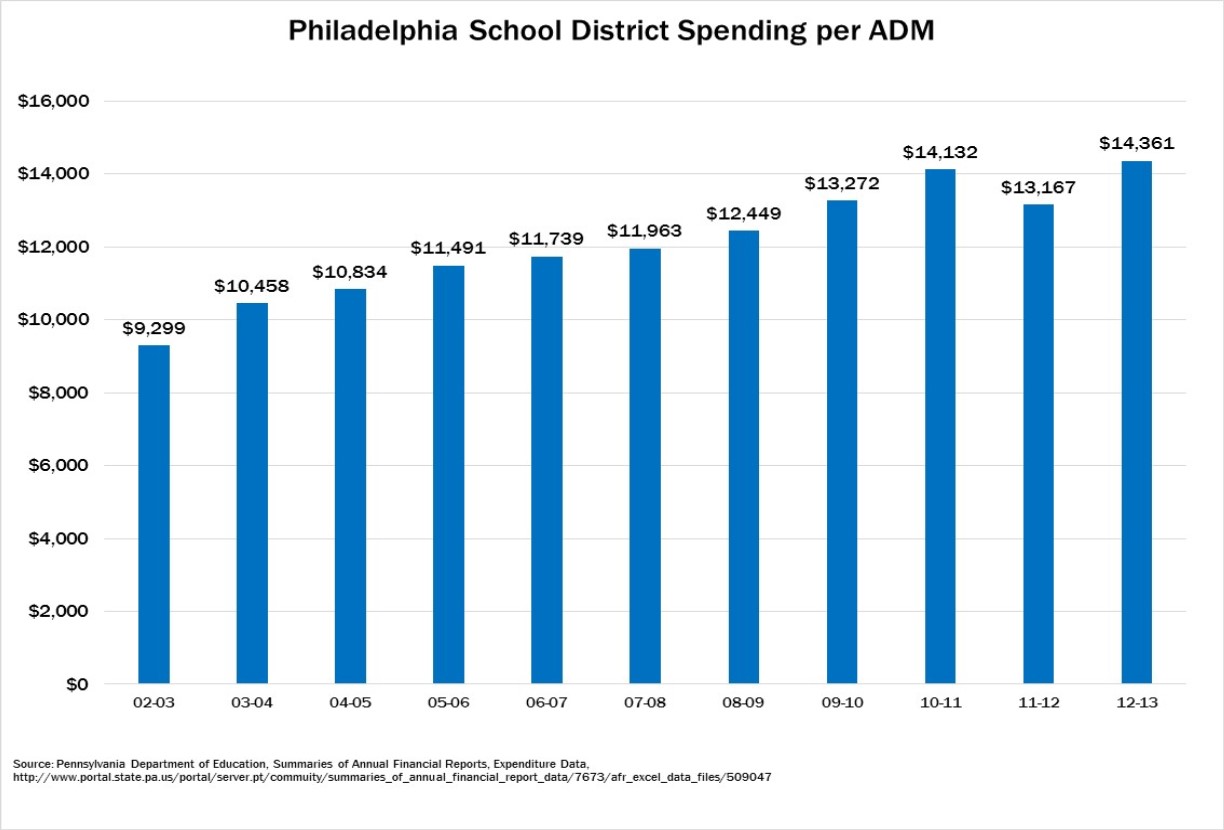
- Total spending per Average Daily Membership (ADM) grew by 21 percent in inflation-adjusted 2012 dollars.
- The spending per ADM represents total spending for all students residing in the district, including those enrolled in charter schools. Charter schools spend and receive less money per student than district schools.
Despite Spending More on Education, Performance is Lagging
- Philadelphia is one of several large city school districts participating in the “Nation’s Report Card” using the National Assessment of Educational Progress (NAEP) scores every two years. Progress has been flat since 2009. In 2013:
- More than 80 percent Philadelphia students failed to make proficiency in both reading and math.
- Philadelphia’s fourth and eighth graders scored below average, when compared to other large U.S. cities, in both reading and math.
- For both grade levels and subject matters, Philadelphia had approximately twice the number of students perform “below basic” than other participating cities.
- Philadelphia charter schools outperformed Philadelphia district schools in the 2012-2013 Department of Education’s School Performance Profile. The average charter school earned a score of 66, while the average district school was at 57.5.
- As a result, many parents are choosing to take their children out of district schools and enroll them in charter schools. Yet demand exceeds capacity. In 2013, 44,000 students were on waiting lists for placement in a charter school, according to the Pennsylvania Coalition of Public Charter Schools, most of these in Philadelphia.
Enrollment has Declined More Rapidly than Staff
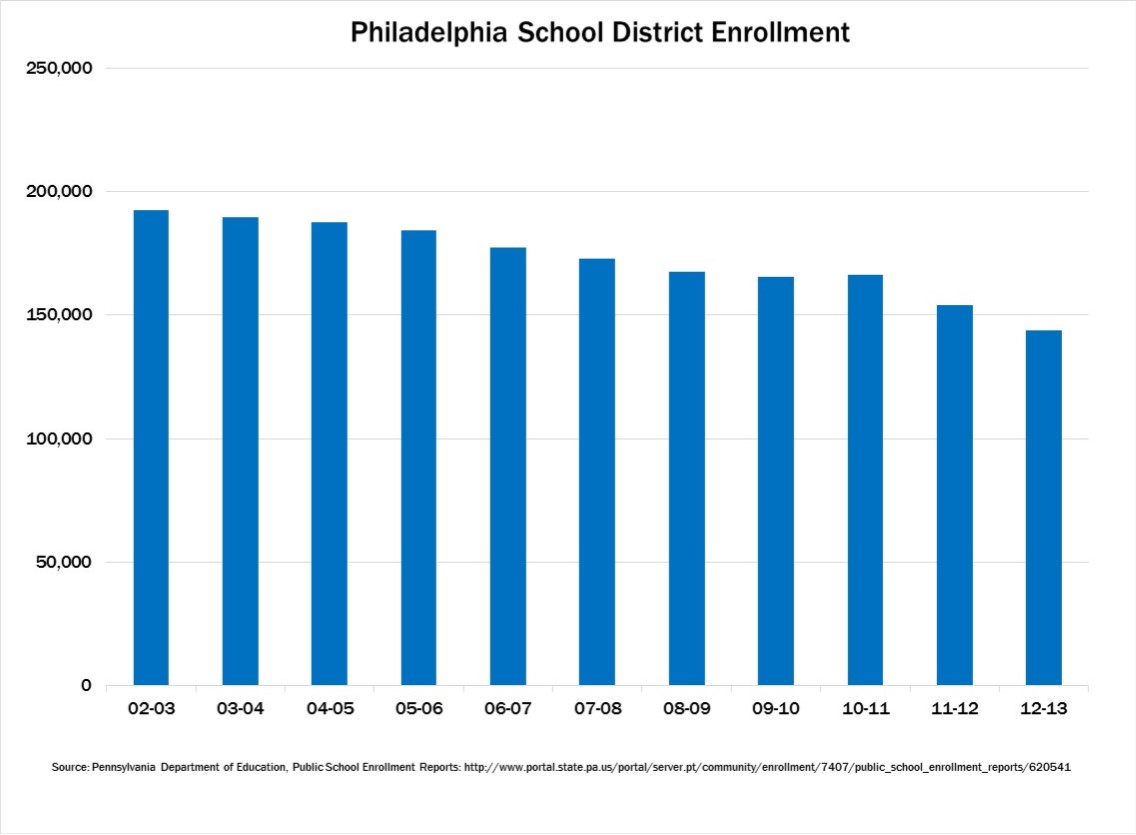
- Enrollment in Philadelphia district schools has consistently declined over the last ten years. The district was responsible for 25 percent fewer students in 2012-2013 than in 2002-2003.
- The district employed 22 percent fewer professional personnel in 2012-2013 than in 2002-2003.
- However, the number of classroom teachers (a subset of professional personnel) declined at one-fourth the rate of enrollment.
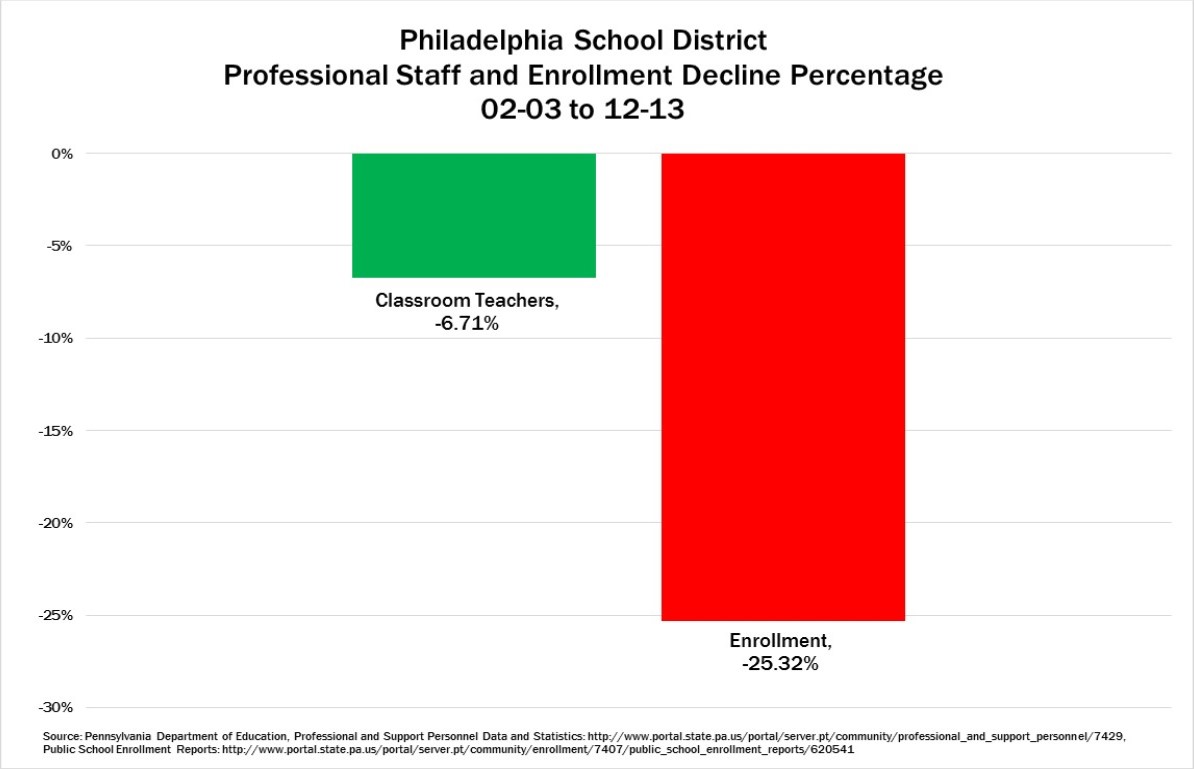
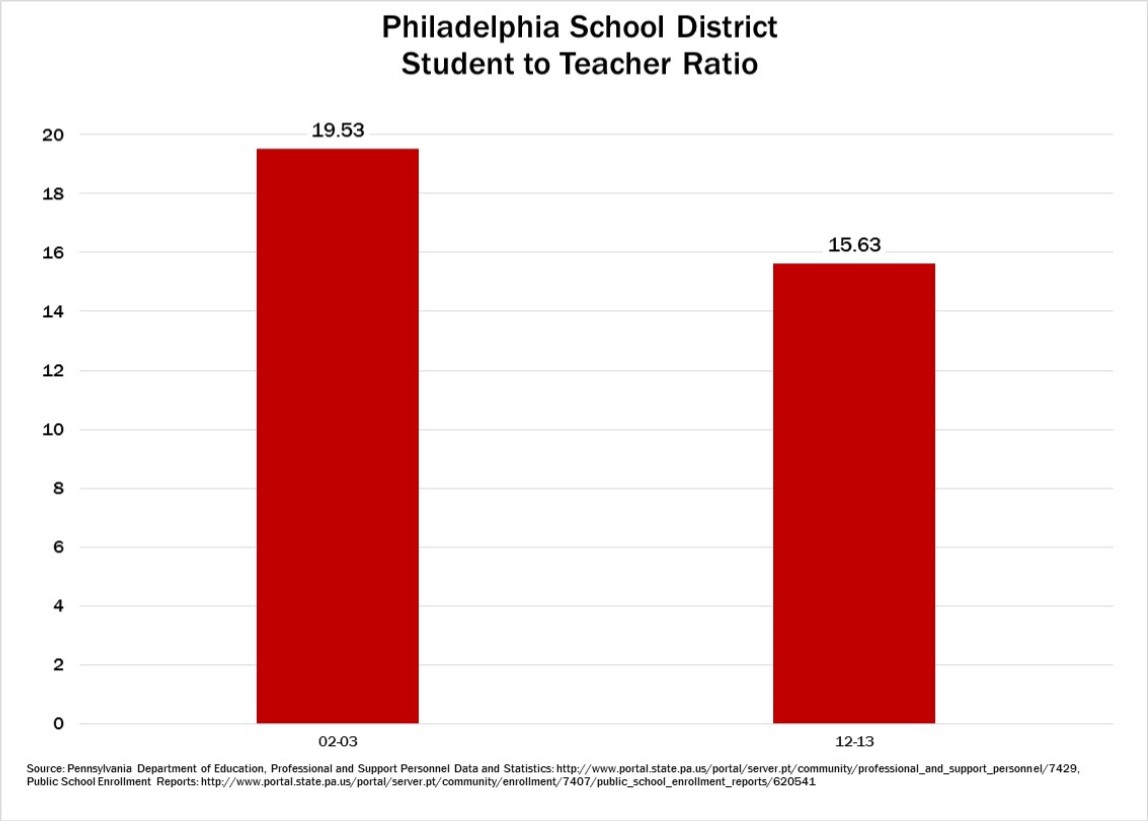
- The student to teacher ratio actually declined by 20 percent over the past decade. In 2012-2013, there were 15.6 students for every classroom teacher in the Philadelphia school district, compared to 19.5 in 2002-2003.
Conclusion
The problems facing Philadelphia parents and families will not be solved with additional taxes. Systemic reform is needed. This should include expanded school choice, union concessions in labor contracts, and seniority reform to end “Last-in, First-out” rules.