Fact Sheet

Pennsylvania K-12 Education Spending
Pennsylvania’s FY 2011-12 total operating budget of $63.4 billion, which included $27.1 billion in General Fund spending, represented the first year-to-year reduction in state spending in at least 40 years. However, as the economy continues to struggle out of a recession and with increasing costs in public welfare, corrections, pensions, and debt, the FY 2012-13 budget will require even more difficult decisions by the General Assembly and Governor Corbett to put Pennsylvania on a path to prosperity.
Pennsylvania Public School Spending Continues to Grow
- Overall K-12 revenue and spending has dramatically increased in Pennsylvania over the last 15 years.
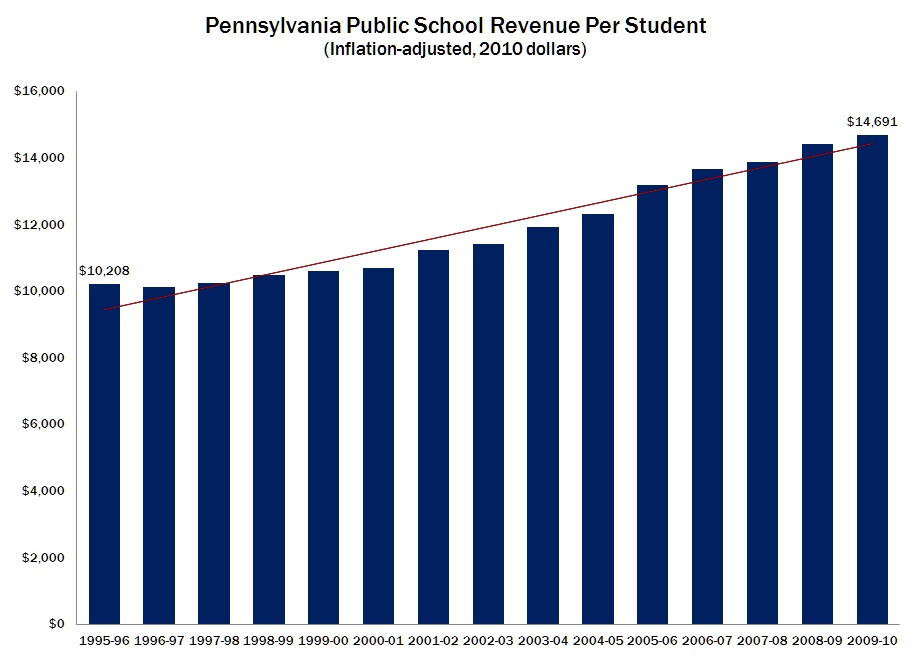
- Pennsylvania’s K-12 education revenue increased from $13 billion in 1995-96 to $26 billion in 2009-10. Adjusted for inflation, that represents a 44% increase in revenue per student.
- Pennsylvania school districts spent more than $14,000 per student in the 2009-10 school year.
- School construction and debt spending has more than doubled in the last 15 years, increasing by 140% from $1.2 billion in 1996-97 to $2.9 billion in 2009-10.
- Prevailing wage laws increase the average cost of construction by 20% or more; repealing this mandate would save $400 million a year in property taxes.

Public School Staffing has Increased while Student Enrollment has Declined
- Student enrollment has decreased by 35,510 since 2000 while schools have hired 35,821 more staff members.
- Most of these new employees pay hundreds of dollars in dues and fees to the PSEA or PFT labor unions as a condition of employment.
- In 2010-11, the PSEA spent $4.2 million in dues on political activities and lobbying against substantive education reforms, including school choice, teacher evaluations, and taxpayer control of tax increases.
K-12 Public Education Performance has Stagnated
- Despite these spending and staff increases, performance on the National Assessment of Educational Progress, the national exam used to compare state performance, has changed little.
- Academic studies have found little or no correlation between student achievement and class size, teacher salaries, or per-student expenditures.
- A 2010 study by 21st Century Partnership for Science, Technology, Engineering, and Mathematics Education (21PSTEM) comparing 11th grade math, reading, and science scores on Pennsylvania state tests with district per-student spending found low-spending districts often outperform high-spending ones.
- Another 21PSTEM study looked at the 30 Pennsylvania school districts that improved the most on 11th grade reading and math performance and the 30 districts that declined the most from 2004 to 2010. Schools that declined in performance had higher increases in total per-student spending.
- Pennsylvania’s average composite SAT score in reading and math has hovered around 995 for the last 15 years, despite doubling spending.
Public Schools have $2.8 Billion in Reserves
- At the end of the 2009-10 school year, public schools had $2.82 billion in fund reserves.
- This includes $1.7 billion in undesignated funds, and $1.1 billion in funds designated for specific future use.
- School reserve funds have grown by 140% (from $1.3 billion to $2.8 billion) since 1996-97.
School Choice Costs Taxpayer Less
- Private, charter and home schools educate more than 380,000 children at far less cost to taxpayers than the $14,000 per student spent by school districts.
- Private, nonpublic schools serve more than 287,000 students with some receiving state support (including transportation costs going to school districts) of less than $1,000 per student.
- Educational Improvement Tax Credit scholarships—which averaged about $1,000 per scholarship in 2009-10—served approximately 39,000 students with an average family income of less than $30,000.
- Charter schools, including cyber charter schools, served 90,000 students in 2009-10 at about $2,400 less per student than school districts spent.
- Homeschooled children, approximately 22,000 according to 2007-08 data from the Pennsylvania Department of Education, receive no direct taxpayer support.
- Parents choosing non-traditional public schools saved taxpayers more than $4 billion in the 2009-10 school year, based on school district spending per student.
| Total Taxpayer Savings from Students Attending Schools of Choice | |||
| 2009-10 School Year | |||
| Savings Per Student* | Number of Students** | Total Savings | |
| Private and Nonpublic | $13,279 | 287,092 | $3,812,403,692 |
| EITC Scholarship Students | $12,235 | 38,646 | $472,848,486 |
| Home School | $14,301 | 22,000 | $314,622,000 |
| Public Charter (Total) | $2,367 | 73,054 | $172,903,936 |
| Cyber Charter | $3,366 | 20,406 | $68,685,860 |
| Total | 382,146 | $4,299,929,628 | |
| * Includes All state funding for nonpublic schools plus tax credits for EITC scholarships as a cost. ** Homeschooling enrollment estimate based on 2007-08 PDE data. | |||
| Sources: PA Department of Education, Summaries of Annual Financial Report Data; Public School Enrollment Reports, http://www.portal.state.pa.us/portal/server.pt/community/data_and_statistics/7202 | |||
# # #
For more information on the Pennsylvania State Budget, visit www.CommonwealthFoundation.org/Budget