Fact Sheet

Pennsylvania Government Debt
Today, Pennsylvanians owe $121 billion in state and local government debt. This equates to more than $9,400 for every person, and almost $38,000 for the average family of four in the commonwealth—an increase of $10,300 since 2002.
- This total represents debt in the form of government bonds, but excludes unfunded pension and healthcare liabilities for government workers, borrowing for unemployment compensation, and short-term tax anticipation notes, which add tens of billions more in obligations for Pennsylvania taxpayers.
| Pennsylvania State & Local Government Debt | ||
| Debtor | Debt Outstanding | Per Person |
| Total State | $45,020,310,000 | $3,533 |
| State | $10,356,710,000 | $813 |
| State Agencies & Authorities | $34,663,600,000 | $2,720 |
| Total Local | $75,759,706,000 | $5,945 |
| School Districts | $26,618,928,378 | $2,089 |
| County/Municipal/Twp/Other | $49,140,777,622 | $3,856 |
| Total | $120,780,016,000 | $9,478 |
| Sources: Governor’s Executive Budget (http://www.budget.state.pa.us) December 2011 data; PA Dept of Education (http://www.pde.state.pa.us) June 2010 data; U.S. Census Bureau (http://www.census.gov/govs/www/estimate.html) 2009 data | ||
State Debt
Since 2002, total outstanding state general obligation debt increased 54%, from $6.8 billion to $10.3 billion.
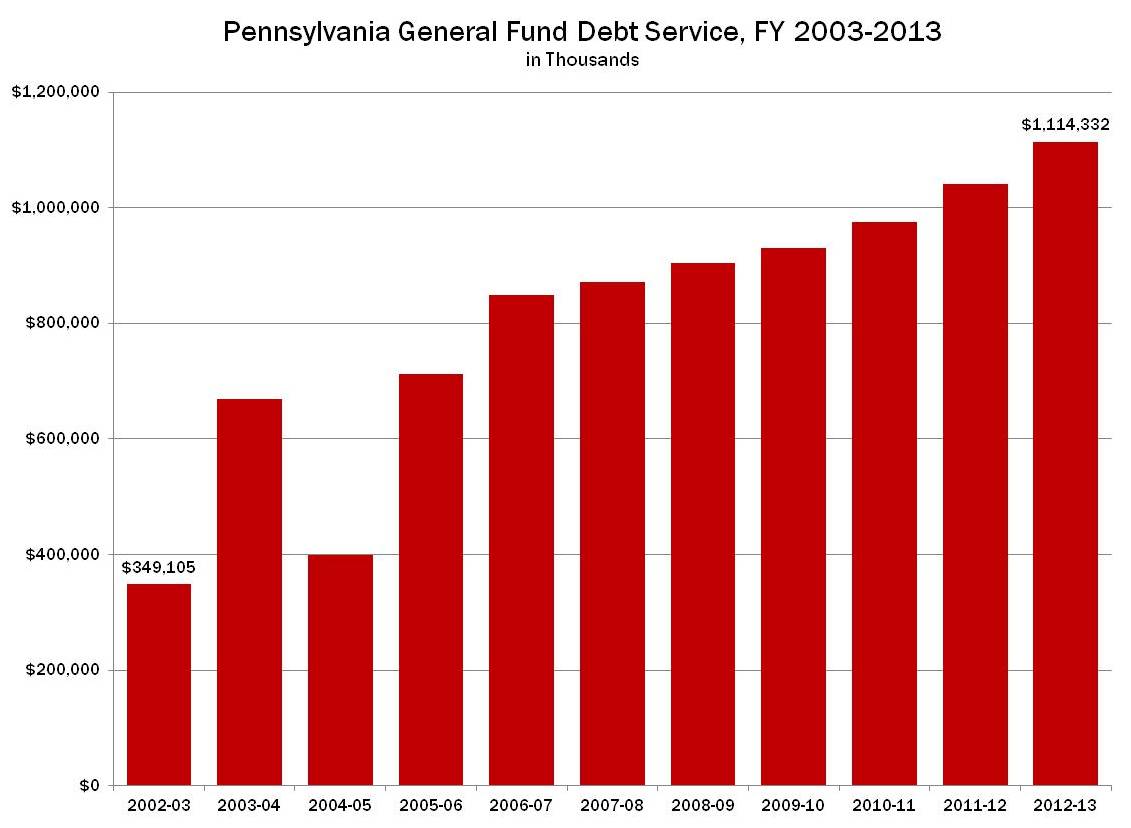
- Annual debt payments on general obligation bonds increased from $349 million in FY 2002-03 to $1.1 billion in the proposed FY 2012-13 budget, an increase of 198% in annual debt payments in nine years.

State Agencies’ & Authorities’ Debt
More than three-fourths of Pennsylvania’s state-level borrowing is done by off-budget state agencies and authorities, like the Turnpike Commission and the Commonwealth Financing Authority, which issue their own debt to the extent authorized by the legislature.
- Debt held by state agencies and authorities increased from $16.8 billion in 2002 to nearly $34.7 billion in 2011—an increase of 106%.
- Total Pennsylvania state and state agencies’ and authorities’ debt increased from $23.7 billion to more than $45 billion in the last nine years—representing a total state-level increase of 90%.
| Pennsylvania State, State Agencies’ & Authorities’ Debt | ||||
| Debtor | Debt Outstanding 2002 | Debt Outstanding 2011 | Increase | Change |
| State | $6,805,184,000 | $10,356,710,000 | $3,551,526,000 | 52% |
| State Agencies & Authorities | $16,848,800,000 | $34,663,600,000 | $17,814,800,000 | 106% |
| Total State | $23,653,984,000 | $45,020,310,000 | $21,366,326,000 | 90% |
| Sources: Governor’s Executive Budget (http://www.budget.state.pa.us) December 2011 data | ||||
School District Debt
Pennsylvania taxpayers are also experiencing an increase in debt at the school district level.
- According to the Pennsylvania Department of Education, school district debt increased from $19.4 billion in 2002 to $26.6 billion in 2010—an increase of 38%.
County, Municipal, Township, & Special District Debt
Other local government debt—debt held by counties, cities, townships, boroughs, and special districts—represents more than 40% of all taxpayer debt in the Commonwealth.
- According to the U.S. Census Bureau’s most recent data (2009), county, municipal, township, and special district debt increased from $45 billion in 2002 to $49 billion in 2009—an increase of 9%.
| Pennsylvania School District, County, Municipal, Township, Special District Debt | ||||
| Debtor | Debt Outstanding 2002 | Debt Outstanding 2010 | Increase | Change |
| School Districts | $19,351,014,152 | $26,618,928,378 | $7,267,914,226 | 38% |
| County/Municipal/Twp/Other | $44,943,251,000 | $49,140,777,622 | $4,197,526,622 | 9% |
| Total Local | $64,294,265,152 | $75,759,706,000 | $11,465,440,848 | 18% |
| Sources: PA Dept of Education (http://www.pde.state.pa.us) June 2010 data; U.S. Census Bureau (http://www.census.gov/govs/www/estimate.html) 2009 data | ||||
# # #
For more information on the Pennsylvania State Budget, visit www.CommonwealthFoundation.org/Budget.