Backgrounder

Pa. Economic Trends September 2022
Overview
Families across the country continue to feel the pressure of rising prices. The Consumer Price Index is up 8.3% over the last year, and while gasoline prices have fallen over the last two months, consumers are facing increased prices at the grocery store and homeowners are dealing with increases on their energy bills.
At the same time, Pennsylvania’s economy remains sluggish in its recovery, with fewer jobs and fewer individuals in the labor force compared with pre-pandemic levels. Pennsylvania has the 8th highest unemployment rate in the nation, and more than 93,000 individuals have dropped out of the labor force entirely. While 20 states have fully recovered from pandemic era job losses, Pennsylvania has lost 108,200 payroll jobs, or 1.8%, since February 2020.
State Employment and Unemployment Data
Pennsylvania’s unemployment rate for August 2022 sits at 4.2%.
- This ranks the 8th highest among states.
- Only Delaware, Maryland, New Mexico, Nevada, Alaska, New York and Illinois have higher unemployment rates.
- This rate is also significantly higher than US Average of 3.7%.
But the unemployment rate only tells part of the story. The Labor Force Participation Rate (the percentage of the population employed or looking for work) and the Employment-to-Population ratio are both significantly below pre-pandemic levels. Those who have dropped out of the labor force entirely and aren’t seeking work don’t count towards the official unemployment rate.
- Approximately 110,000 Pennsylvanians have dropped out of the labor force between January 2020 and August 2022.
- While 20 states have fully recovered from pandemic-era job losses—led by Utah and Idaho, which have more than 6% job growth since February 2020—Pennsylvania continues to have fewer people working.
- Pennsylvania has lost 108,200 payroll jobs since February 2020, a 189% decline.
- Only New York and Ohio have lost more total jobs in that time frame.
- The Independent Fiscal Office forecasts that Pennsylvania won’t fully recover to pre-pandemic employment levels until 2025.
Inflation
While the Biden administration was hosting a party, attended by Gov. Tom Wolf, celebrating the Inflation Reduction Act, the Bureau of Labor Statistics released new data showing overall consumer prices rose again in August.
- The Consumer Price Index shows prices have risen 8.3% since last August, near a 40-year high, and up more than 12.7% since Biden took office.

- The “All Items less Shelter” index has increase 9.3% in year-over-year measure.
- This is a perhaps a more accurate measure of price increases and is used by the Pennsylvania Independent Fiscal Office (IFO). The CPI measure for shelter is based largely on “imputed rent” for owner-occupied homes, which hasn’t reflected measure the dramatic increases in home prices over the last two years.
- While gasoline prices dropped by more than 10% in August (though it is still up 26% over the prior year), everything else went up.
- Over the past year (August to August), here are the price increases for selected items:
- Food at home: 13.5%
- Coffee: 17.6%
- Gasoline: 25.6%
- Fuel Oil: 68.8%
- Electricity: 15.8%
- Utility gas service: 33.0%
- Household Furnishings: 10.6%
- New Cars: 10.9%
- Health Insurance: 24.3%
- Transportation Services: 11.3%
- Smartphones: Down -20.4%
- Televisions: Down -19.1%
The CPI for the Philadelphia Metro Region shows an 8.1% year-over-year increase.
- This is slightly lower than the US average for urban consumers.
- The All Items less Shelter index for Philadelphia has risen 8.8%, also slightly less than the national average.
- Inflation in the Philadelphia Metro Region has been higher than New York and Washington, but lower than Baltimore or Chicago.
Pennsylvania families are in for some more sticker shock in the coming months—or have already seen rate increases not reflected in the August data.
- Several Pennsylvania utilities rose electric rates on September 2022, by as much as 18% to 19%for Met-Ed, Penelec, and Penn Power electric customers.
- UGI natural gas rates for residential customers rose 7.6% on September 1.
- US Post Office rates will be going up in October.
- Pennsylvania Turnpike tolls will rise by 5% in January.
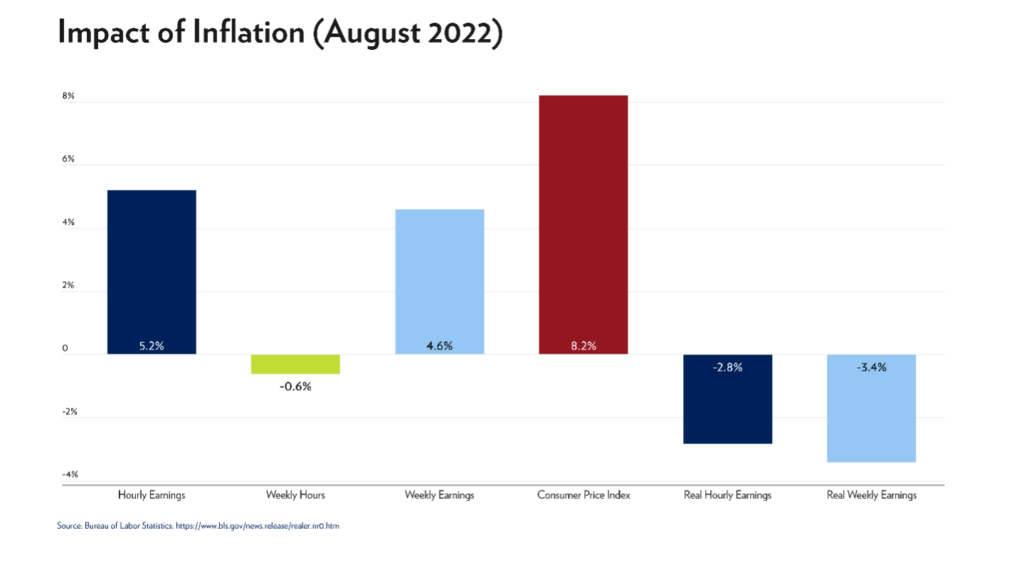
Hourly & Weekly Wages
Nationally, real hourly wages—after adjusting for inflation—have declined 2.8% over the past year.
- That is, raw wages have gone up, but not enough to combat inflation, so workers are really getting less in terms of buying power.
- Adding to that, workers are, on average, working less—and real weekly pay is down 3.4% since last year.

Annual Census Data
Annual data from the US Census released this week, releases of Income, Poverty, and Health Insurance Coverage in the United States and state data from the Annual Community Survey further show income isn’t keeping pace with inflation levels.
- According to the Current Population Survey, US median income declined for second straight year in 2021 when adjusted for inflation. The median income has dropped by over $2,000 since its peak in 2019. (See table D-1)
- Pennsylvania median household income also declined for the second straight year, when adjusted for inflation. The metric decreased by $2,173 from 2019 to 2021.
Poverty
- The official US poverty rate increased slightly in 2021, from 11.5% to 11.6%. The rate now sits 1.1 percentage points higher than the 2019 rate of 10.5%.
- Pennsylvania’s poverty rate for all persons increased from 2019 to 2021 and currently sits at 12.1%.