Fact Sheet

Education Spending & Academic Achievement
Increased education spending has not led to improved academic performance. This is reflected in SAT scores and NAEP results, as well numerous studies at the state, national, and international level. To improve academic performance, policymakers should pursue a student-based funding formula, mandate relief, and expanded school choice.
Education Spending in Pennsylvania
- Education spending in Pennsylvania is at an all-time high. Since the 1970s, state aid for education has increased by 41 percent in inflation-adjusted dollars.
- According to the National Education Association, Pennsylvania ranked 11th in the nation in spending per student in 2013-14.
- This exceeds the national average by $3,700.
|
Public School Revenue per Student, 2011-12 |
||||
|
Per Pupil Revenue |
Total |
Federal |
State |
Local |
|
United States |
$12,152 |
$1,235 |
$5,493 |
$5,423 |
|
Pennsylvania |
$15,134 |
$1,243 |
$5,417 |
$8,474 |
|
PA Rank |
10 |
25 |
25 |
7 |
|
Source: National Center for Education Statistics, Digest of Education Statistics, Table 235.20. Revenues for public elementary and secondary schools, by source of funds and state or jurisdiction: http://nces.ed.gov/programs/digest/d14/tables/dt14_235.20.asp |
||||
- Pennsylvania state taxpayers contribute more than $5,000 per student, which is comparable to the national average.
- Local revenue per student exceeds the national average by $3,000.
- State taxpayers currently fund 35 percent of total education spending. The “state share” has not exceeded 40 percent since 1976-77, according to records from the Pennsylvania Department of Education.
- In 1974-75, the state share reached its high-water mark of 45 percent.
Research Indicates a Weak or Non-Existent Relationship Between Spending and Outcomes
- Andrew Coulson of the Cato Institute controlled for student participation rates and demographics to compare state level SAT performance between 1972 and 2012.
-
- SAT scores declined by an average of 3 percent despite an average state education spending increase of 120 percent. Adjusted SAT scores in Pennsylvania dropped by 7 percent.
- Across all states, Coulson found no correlation (0.075) between spending and outcomes.
- A study from 21st Century Partnership for STEM Education, funded by the National Science Foundation, found “no or very weak association between levels of education expenditures and 11th grade student achievement after controlling for other variables” when analyzing Pennsylvania school districts.
- There is no discernable difference in student achievement on the Pennsylvania System of School Assessment (PSSAs) and SATs when comparing the 50 districts with the highest per-pupil expenditures with the 50 districts with the lowest per-pupil expenditures.
- Just as many students achieved math and reading proficiency in districts spending $12,000 per pupil as in districts spending $20,000 per pupil.
- The authors found total per-pupil expenditures are not associated with PSSA proficiency or higher SAT scores: “The correlations between these variables are near zero and in some cases slightly negative.” Correlation between the change in spending and the change in outcomes is also weak.
- The left-leaning Center for American Progress (CAP) measured the achievement of school districts relative to their spending—while controlling for cost of living and economically disadvantaged students.
- CAP authors found low educational productivity in both high-spending and low-spending school districts and concluded that too many education dollars are being spent unwisely.
- Only 37 percent of districts in the top third in spending were also in the top third in achievement.
- Few states regularly rate and report on the productivity of local school dollars, and many state assessments of productivity are “inconsistent and opaque.”
Academic Performance is Stagnant Despite Funding Increases
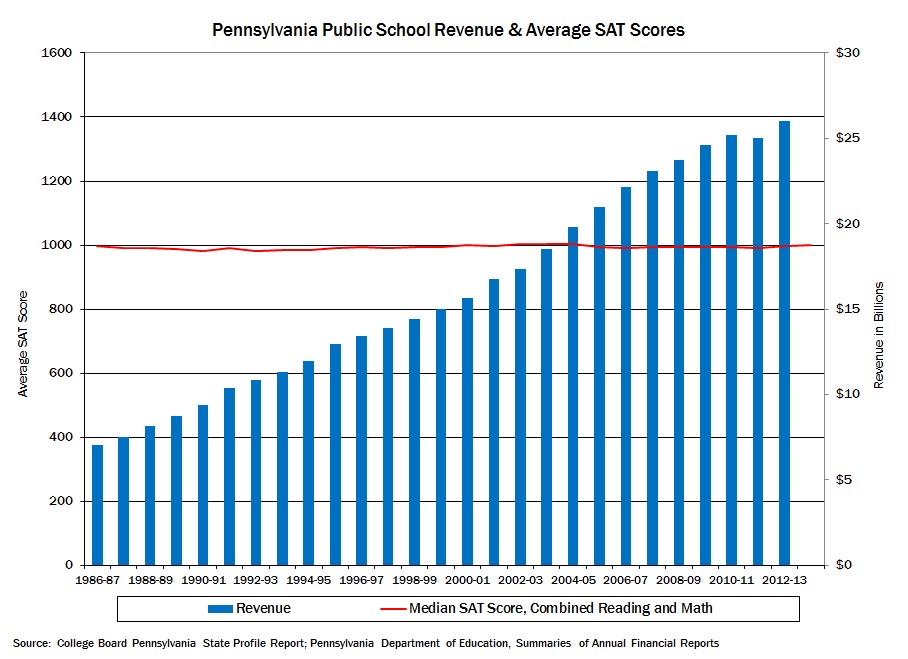
- Despite large increases in education spending, SAT scores have stagnated over the last several decades.

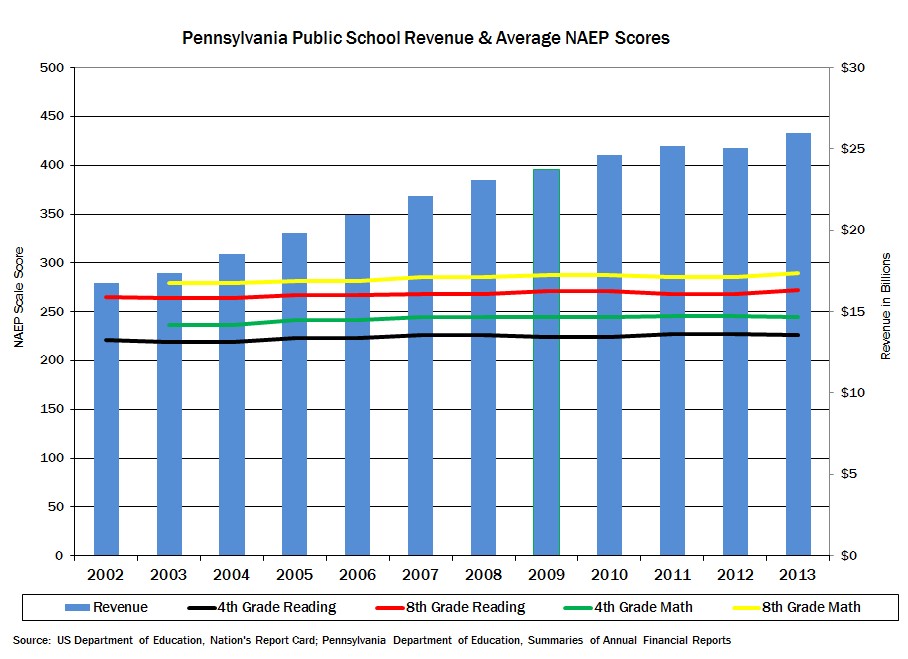
- The same trend is evident in National Assessment of Educational Progress (NAEP) scores, which have flatlined over the last decade.

Academic Performance in the International Context
- The Organization for Economic Cooperation and Development (OECD) administers the Program for International Student Assessment (PISA) which compares student performance across the globe. Each of the 34 OECD member countries participated in the 2012 PISA.
- The United States is among the highest spenders, but produces middling achievement. The U.S spends over $12,000 per student, which exceeds the OECD average of $7,000, but ranks well below average in math, reading, and science.
- Of the 34 OECD countries, U.S. students rank 26th in math, 17th in reading, and 21st in science. Performance trends over time show no improvement for U.S. students in math, reading, or science.
- Several countries achieve better performance despite spending significantly fewer dollars.
- Slovakia performs similarly to the U.S. but spends 50% less per student. Korea, a top-five performer in both reading and math, spends below the international average.
Recommendations
Trends in spending and performance suggest that higher taxes will not produce better achievement, and policymakers should seek alternative solutions, including a new funding system, mandate relief, and school choice.
- Pennsylvania’s outdated education funding system should be reformed in favor of a student-based model that accounts for enrollment and student need.
- A weighted student funding (WSF) model would direct education dollars more transparently, efficiently, and equitably.
- Low-income students, English language learners, and students with disabilities could be weighted with additional funding on a per-pupil basis. WSF recognizes and accounts for the fact that certain students have greater educational needs.
- WSF eliminates much of the disparity in per-pupil state aid while ensuring that education dollars follow the student.
- Repeal state mandates that are diverting too many dollars from the classroom.
- Lawmakers should renew Pennsylvania’s Mandate Waiver Program that expired in 2010.
- Repealing “last-in, first-out” furlough mandates, introducing merit pay, and reforming the tenure process would provide more Pennsylvania children with access to higher quality teachers.
- Adjusting Pennsylvania’s Prevailing Wage mandate would free up dollars to be spent in the classroom.
- In 2012, districts spent $1.6 billion in construction costs. Eliminating the mandate would save local taxpayers between $160 and $480 million per year.
- 18 states do not currently impose prevailing wage mandates.
- Expand school choice programs, such as the Educational Improvement Tax Credit (EITC) and the Opportunity Scholarship Tax Credit (OSTC).
- These programs allow low and middle income families to attend better, safer schools.
- The EITC and OSTC also result in large savings to Pennsylvania taxpayers. The average EITC scholarship is less than $2,000, while the average OSTC scholarship is approximately $4,000. These scholarships are significantly less than the average per-pupil spending in traditional public schools.
# # #
The Commonwealth Foundation is Pennsylvania’s free-market think tank.
For more on Education Reform, visit CommonwealthFoundation.org