Executive Summary

Cutting Red Tape in Pennsylvania
This report presents findings from Mercatus Center’s State RegData database, analyzing regulations in the Pennsylvania Code as of 2022. The report provides an overview of state regulations, how Pennsylvania’s regulatory burden compares to other states, and estimates the benefits of regulatory reform in Pennsylvania.
Key Findings
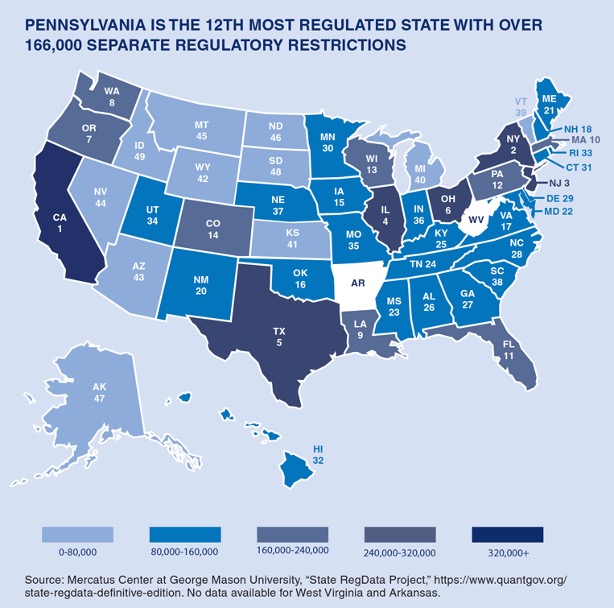
- Pennsylvania enforces 166,219 regulatory restrictions, making it about 22 percent more regulated than the average state (136,262 regulations).
- Recent efforts that significantly reduced regulatory burdens in states and provinces resulted in accelerated economic growth. In British Columbia, cutting regulatory requirements by 36 percent corresponded with an additional one percent growth in gross domestic product (GDP) each year.
- .If Pennsylvania were to similarly reduce 36 percent of its regulatory requirements, GDP could increase by an estimated $9.2 billion per year, with compounded growth in the future.
- A $9.2 billion increase to GDP is equivalent to approximately $1,760 per household, and 183,497 new jobs in Pennsylvania.

Executive Summary
Across the United States, the average state enforces about 136,262 regulations. However, there is a large variation in the number of regulatory restrictions across the states. Idaho, for example, has just 36,612 restrictions, while California has 403,774.[1] In recent years, governors from several states, including Idaho, Rhode Island, and Ohio, have made efforts to significantly reduce the number of regulations.[2] Meanwhile, Virginia is on track to meet a 25 percent reduction goal over three years.[3]
As of 2022, there are 166,219 regulatory restrictions in the Pennsylvania Administrative Code, about 22 percent more than the average state. It would take approximately 740 hours to read the Pennsylvania Administrative Code at a pace of 300 words per minute.[4]
Federal regulations also burden families and businesses, and have disparate impacts on states, based on their economic composition. A 2022 Mercatus analysis of the impact of federal regulations on Pennsylvania’s economy calculates that regulation growth from 1997 to 2017 is associated with 187,575 more people living in poverty in Pennsylvania in 2019 as well as increased income inequality.[5]
Mercatus’s State RegData uses a machine-learning algorithm to identify regulations targeted to specific industries. Findings show paper manufacturing is the most regulated industry in Pennsylvania.
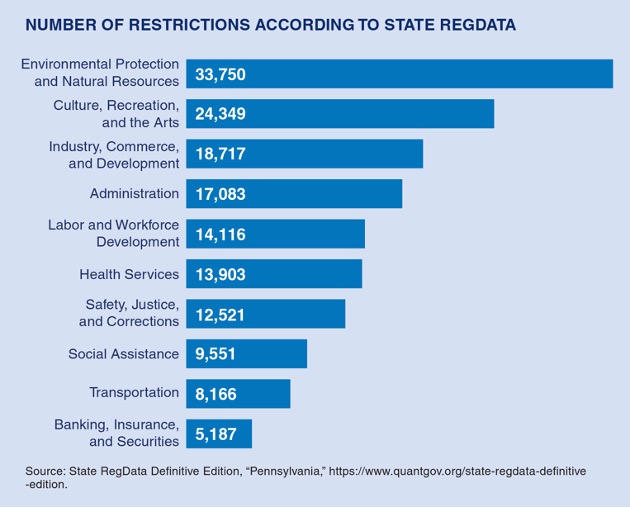
Looking at broader areas of regulation, Pennsylvania applies 33,000 regulations to environmental protection and natural resources. Some regulations can be more costly in terms of time or compliance fees. For example, Pennsylvania’s entrance into the Regional Greenhouse Gas Initiative (RGGI)—technically a regulation promulgated by the Department of Environmental Protection and still under court review[6]—is estimated to cost upwards of $800 million a year.[7]

Often, overregulation comes from the sheer volume of regulations and difficulty in small businesses addressing the complex web of regulations that may affect their operations.
Overregulation can have widespread impacts on the economy. While the average state saw 7.4 percent population growth from 2010 to 2020, Pennsylvania only saw 2.4 percent growth.[8] According to data from the U.S. Census Bureau, Pennsylvania had the nation’s fourth-largest numeric decline in population between 2021 and 2022.[9]
Research on the effects of regulatory reduction in British Columbia, Canada showed that a 36 percent reduction in regulation was related to a 1 percent increase in economic growth.[10] If Pennsylvania were to cut roughly 55,400 regulations (36 percent), GDP growth could increase by roughly $9.2 billion per year, with compounded growth in the future. This would yield approximately $1,760 per household and 183,497 job equivalents, roughly a 3 percent increase.[11]
Conclusion
Pennsylvania is 22 percent more regulated than the average state, with a total of 166,219 state regulatory restrictions. If Pennsylvania reduced regulations, incomes and job creation would increase. Specifically, cutting regulations by 36 percent, could yield $9.2 billion in GDP growth and more than 180,000 new jobs.
[1]RegHub, “State RegData Definitive Edition, Regulations,” Mercatus Center at George Mason University, accessed May 1, 2023, https://www.reghub.ai/data/bulk.
[2]James Broughel and Dustin Chambers, “Learning From State Regulatory Streamlining Efforts,” (Washington DC: National Governors Association, July 2022), https://www.nga.org/publications/learning-from-stateregulatory-streamlining-efforts/.
[3]Reeve T. Bull, “A New Approach to Regulatory Budgeting in Virginia,” Regulatory Review, May 29, 2023, https://www.theregreview.org/2023/05/29/bull-a-new-approach-to-regulatory-budgeting-in-virginia/.
[4]RegHub, “State RegData.”
[5]Dustin Chambers and Colin O’Reilly Policy Brief (2022): “The Regressive Effects of Regulations in Pennsylvania,” Arlington VA: Mercatus Center at George Mason University, April 12, 2022), https://www.mercatus.org/research/policy-briefs/regressive-effects-regulations-pennsylvania-0.
[6]Harry Leigh, “Regional Greenhouse Gas Initiative’s Future Argued before Pa. Supreme Court,” FOX43, May 23, 2023, https://www.fox43.com/article/news/local/pa-supreme-court-rggi-injunction/521-237b7236-1f9c-49f0-89c3-8dd2350424ff.
[7]Matthew Knittel, “Testimony on RGGI Modeling Assumptions,” Independent Fiscal Office, March 28, 2022, http://www.ifo.state.pa.us/download.cfm?file=Resources/Documents/IFO_Testimony_RGGI_Nov_4_2022.pdf.
[8]U.S. Census Bureau, 2010 Census: Redistricting File (Public Law 94-171) Summary File, January 2011, https://www.census.gov/data/datasets/2010/dec/redistricting-file-pl-94-171.html; U.S. Census Bureau, 2020 Census Redistricting Data (P.L. 94-171) Summary File, June 2021, https://www.census.gov/programs-surveys/decennial-census/about/rdo/summary-files.html.
[9]U.S. Census Bureau, “Growth in U.S. Population Shows Early Indication of Recovery Amid COVID-19 Pandemic” (Press Release Number CB22-214), December 22, 2022, https://www.census.gov/newsroom/press-releases/2022/2022-population-estimates.html.
[10]Laura Jones, “Cutting Red Tape in Canada: A Regulatory Reform Model for the United States?” (Arlington VA: Mercatus Center at George Mason University, November 11, 2015), 21-23, https://www.mercatus.org/research/research-papers/cutting-red-tape-canada-regulatory-reform-model-united-states.
[11]U.S. Bureau of Economic Analysis, “Economic Profile for Pennsylvania (2022),” March 31, 2023, https://apps.bea.gov/regional/Bearfacts/; U.S. Census Bureau, “Pennsylvania: Families and Living Arrangements,” accessed August 2, 2023, https://data.census.gov/profile/Pennsylvania?g=040XX00US42; U.S. Bureau of Labor Statistics, “Occupational Employment and Wage Statistics: May 2022 State Occupational Employment and Wage Estimates, Pennsylvania,” April 25, 2023 [modification date], https://www.bls.gov/oes/current/oes_pa.htm; U.S. Bureau of Labor Statistics, “State and Metro Area Employment, Hours, and Earnings,” accessed August 2, 2023, https://www.bls.gov/sae/tables/annual-average/2021/home.htm.