Commentary

Liquor Privatization: Just the Facts
In a recent Delaware County Times webcast on Pennsylvania liquor store privatization, on which I was a panelist, there was a great deal of information thrown into the mix which may have confused viewers. This Policy Memo provides some of the facts on liquor privatization.
Data on Social Impacts of Alcohol Use
If government control of wine and liquor sales means a safer state, Pennsylvania should be the one of the safest in the country. This is not the case. Compared to bordering states and the national average, the commonwealth currently ranks in the middle-of-the-pack or worse in alcohol-related deaths and alcohol-related traffic fatalities.
The Commonwealth Foundation uses the Center for Disease Control’s alcohol-attributable deaths statistics, which can be found on the CDC’s Alcohol-Related Disease Impact portal. Proponents of Pennsylvania’s government-run liquor stores use alcohol-induced deaths, which is a narrower and less comprehensive look at the statistics.
- Pennsylvania ranks higher than 5 of 6 border states, and near the U.S. average, in alcohol-attributable deaths per 100,000 residents.
- The commonwealth has more alcohol-related traffic fatalities per 100,000 residents than four of six border states (slightly higher than the U.S. average).
- Pennsylvania ranks higher than 5 of 6 border states in the percentage of traffic fatalities related to alcohol use, at 33 percent, slightly higher than the U.S. average.
- Mothers Against Drunk Driving ranks Pennsylvania 35th in DUI safety, worse than all bordering states but Delaware.
| Alcohol Related Deaths | Alcohol Related Traffic Fatalities, 2010 | MADD Ranking | |||||||
| State | 2011 Population | Total Alcohol Related Deaths (Avg. 2001-05) | Per 100,000 Residents | Number | % of total fatalities | Per 100,000 Residents | Hwy Miles | Per 1,000 State Hwy Miles | DUI-related accidents per capita |
| Pennsylvania | 12,742,886 | 3,249 | 25.50 | 433 | 33 | 3.40 | 121,780 | 3.56 | 35 |
| Delaware | 907,135 | 222 | 24.47 | 36 | 36 | 3.97 | 6,302 | 5.71 | 39 |
| Maryland | 5,828,289 | 1,290 | 22.13 | 154 | 31 | 2.64 | 31,461 | 4.89 | 26 |
| New Jersey | 8,821,155 | 1,791 | 20.30 | 153 | 27 | 1.73 | 38,835 | 3.94 | 16 |
| New York | 19,465,197 | 3,876 | 19.91 | 364 | 30 | 1.87 | 114,546 | 3.18 | 24 |
| Ohio | 11,544,951 | 2,911 | 25.21 | 341 | 32 | 2.95 | 123,024 | 2.77 | 33 |
| West Virginia | 1,855,364 | 576 | 31.05 | 88 | 28 | 4.74 | 38,598 | 2.28 | 20 |
| United States | 311,591,917 | 80,374 | 25.79 | 10228 | 31 | 3.28 | 4,050,717 | 2.52 | |
| Sources: Alcohol Related Deaths: hhttp://apps.nccd.cdc.gov/DACH_ARDI/Default/Default.aspx; Alcohol Related Traffic Fatalities: http://www-nrd.nhtsa.dot.gov/Pubs/811606.pdf; Highway Miles: http://www.fhwa.dot.gov/policyinformation/statistics/2009/hm20.cfm; MADD Rankings: hhttp://www.madd.org/drunk-driving/state-stats/ | |||||||||
| Prepared by Commonwealth Foundation, www.CommonwealthFoundation.org | |||||||||
A survey by the U.S. Department of Health and Human Services ranks Pennsylvania higher than the national average in underage drinking, binge drinking, and underage binge drinking.
| Alcohol Use in past month Age 12-20 | Binge Drinking Age 12-20 | Binge Drinking Age 12 + | |
| Pennsylvania | 29% | 19% | 24% |
| Delaware | 30% | 21% | 25% |
| Maryland | 28% | 18% | 22% |
| New Jersey | 26% | 18% | 23% |
| New York | 32% | 20% | 23% |
| Ohio | 29% | 21% | 26% |
| West Virginia | 24% | 16% | 19% |
| United States | 27% | 18% | 23% |
| Source: U.S. Department of Health and Human Services, Substance Abuse and Mental Health Statistics, http://www.oas.samhsa.gov/2k8State/AppB.htm | |||
| Prepared by Commonwealth Foundation, www.CommonwealthFoundation.org | |||
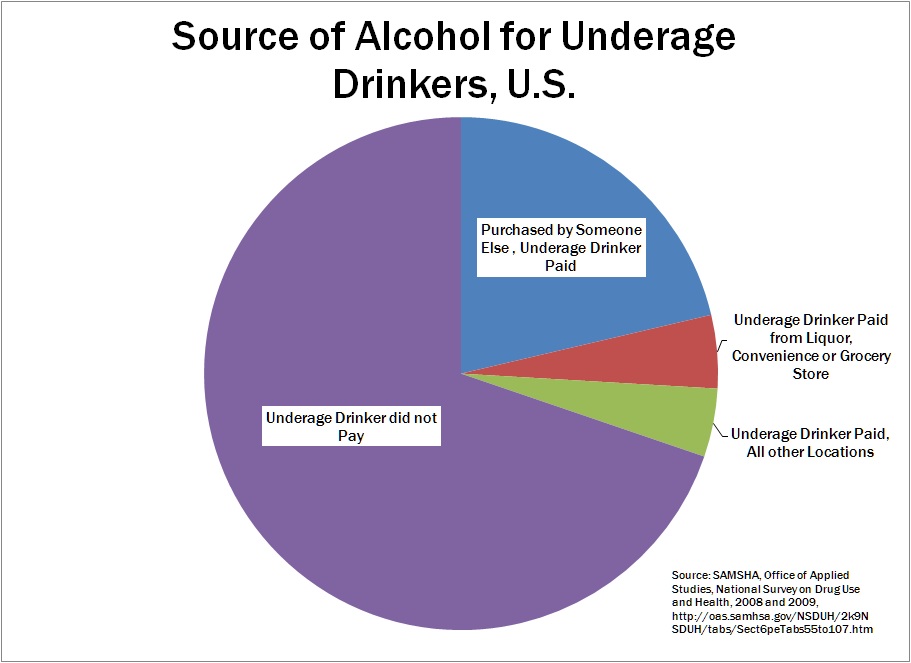
Consider this related fact: In other states, most underage drinkers aren’t going into stores to buy liquor, according to the same survey data. Almost 90% of underage drinkers get their alcohol from someone else. Less than 5% of underage drinkers bought their own alcohol in a store.

Indeed, looking at consumption patterns in Pennsylvania-almost three-fourths of the alcohol consumed in Pennsylvania (which includes beer, along with wine and spirits consumed at restaurants and bars) isn’t sold at PLCB stores-shows why underage drinking isn’t tied to government monopolies over liquor stores.
Studies on Privatization on Alcohol Safety
A review of the existing literature reveals there’s no clear consensus on the social impact of privatization. For example, a 2003 study of alcohol outlet density and DUI fatalities in California over an eight year period found that increased outlet density was associated either with no change in DUI fatalities or a decrease in DUI fatalities, depending on how one defines “density.”[1]
A 2003 study of outlet density among students at eight public universities found a positive relationship between outlet density and self-reported drinking problems.[2] A 2005 study of alcohol privatization in Alberta over the period 1950 through 2000 found no relationship between privatization and DUI fatalities.[3] A 2006 study looking at privatization across all states for a single year found a positive relationship between privatization and DUI fatalities.[4] These andother studies provide conflicting stories as to the relationship between privatization and social outcomes.
This holds true with the studies referenced by opponents of private liquor sales as well. Many associate higher outlet density to increased social harms. A literature review by Dr. Anthony Davies of Duquesne University covers a number of these studies. Often these studies begin from the general consensus that privatization equals more outlets which thereby results in more harm but there is no causality to make that claim. For example, the density of retail outlets could be caused by the propensity of the populace to consume alcohol, not the other way around. Overall the findings concerning density and consumption are mixed, at best.
A Center for Disease Control task force reviewed 21 studies with more than 30-year-old sales data, some of which found increased consumption following privatization; others found no change or decreases. That is, the findings are mixed again. Moreover, and most importantly, none of the studies sampled showed that privatization increased DUIs, alcohol related deaths, underage drinking, or any other social harms.
In fact, the former chair of the American Medical Association, Dr. Raymond Scalettar, recently penned a letter, “There was little proof in privatization op-ed,” in the Harrisburg Patriot-News criticizing the CDC task force conclusion for this same reason. He concludes, “Alcohol consumption habits tend to be culturally driven and macro-level control policies have little to do with drinking patterns.”
A study by Dr. Antony Davies and John Pulito of Duquesne University, commissioned by the Commonwealth Foundation, showed that the level of state control over alcohol sales has no link to underage drinking, binge drinking, and DUI fatalities. A follow-up study by Davies and Pulito examined 49 states over 21 years using sophisticated analytic techniques and finds that states with private alcohol markets have lower alcohol-related fatality rates.
Davies has published several papers on this topic in a variety of peer-reviewed venues, all of which show the same lack of effect of state controls. The most recent was published by the Mackinac Center.
Many of the arguments against privatization aren’t about social harms-for which the evidence shows no link with government control-but increased “consumption” following privatization. Consumption could increase dramatically if every adult drinker had one more glass of wine each month, but this does not create a policy problem. And as long as “consumption” is measured in terms of sales, we expect to see an increase.
Privatization and State Store Employment
A study conducted by the PFM Group, commissioned by Gov. Corbett, concludes private stores will hire many current PLCB employees. The report does not estimate a net gain or loss in liquor store jobs, or estimate how many of the current PLCB employees will transition to the private sector.
The report does suggest that the number of jobs per store at certain types of licensees will be small-but 2 to 3 jobs per licensee would replace the entire workforce in the state store system, which includes about 3,700 liquor store employees. For instance, if the state allowed 1,500 licenses, each retailer would only need to add three new employees to create 4,500 jobs. If the state allowed 3,000 licenses and each retailer again hired only three employees to handle liquor sales, it would create 9,000 jobs.
The number of jobs created will be determined by the number of licenses permitted. Increasing the number of retail stores also means more revenue, recapturing the hundreds of millions of dollars the state loses each year to border bleed. The PFM study found that privatization would bring back $100 million in increased sales by reducing border bleed. More private licenses means more jobs for Pennsylvanians.
PLCB Management
It is a myth that the government-run system is a cash cow for the state. In fact, it’s losing money. The newest financial data from the PLCB shows that the agency ended the 2010-11 fiscal year with negative $31.2 million in net assets.
The PLCB’s laundry list of waste includes millions spent on marketing and advertising, an inventory system that failed to function properly and cost millions more than expected, a since-scrapped wine kiosk program that the PLCB’s own advisors recommended against, and a “wine shrine” where PLCB executives get to sample wine and decide what brands Pennsylvania will and will not be able to buy in the state.
And let’s not forgot that the PLCB produces nothing. Every dollar it collects is a dollar taken from taxpayers and consumers using the government-run monopoly stores.
# # #
For more information on Liquor Store Privatization, visit FreeMyDrink.com.