Media
Who’s Creating Jobs in Pennsylvania?
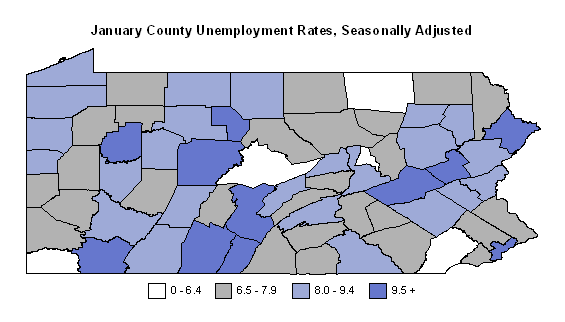
It’s clear the Marcellus Shale is revitalizing rural economies across the commonwealth by increasing local revenue and paying landowners billions of dollars in leases and royalties, but the natural gas boom is also creating high-paying jobs. The map below from the Department of Labor and Industry shows the counties with the lowest unemployment rates in Pennsylvania are mainly concentrated in the Southwest and Northeast, the epicenters of Marcellus Shale drilling.
Employment statistics from the Department of Labor and Industry show a surge in mining and natural resource jobs— climbing 25.5 percent from February 2010 to February 2011. Overall job growth in the Pennsylvania was less than 2 percent.
According to the Bureau of Labor Statistics, employment in the mining and natural resource industry has more than doubled in four counties with significant drilling since September of 2009. These stats only include those employed by a drilling companies and do not accounty for ancillary jobs created, like in trucking and service industries.
| COUNTY | Marcellus Wells Drilled, Sep’09-Sep’10 (Source: PADEP) |
12 month percent change in average [Marcellus] weekly wage, Sep’09-Sep’10 |
12 month percent change in [direct Marcellus] employment, Sep’09-Sep’10 |
12 month change in [direct Marcellus] employment, Sep’09-Sep’10 |
| Bradford | 376 | 105.8% | 203.5% | 633 |
| Tioga | 290 | 139.6% | 66% | 70 |
| Washington | 182 | 5.3% | 34.5% | 442 |
| Lycoming | 101 | 13.7% | 106.6% | 305 |
| Susquehanna | 99 | 52.3% | 72.6% | 313 |
| Westmoreland | 53 | 16.5% | 21.6% | 149 |
| Centre | 41 | 71.3% | 115.6% | 245 |
| Fayette | 37 | 31.2% | 65% | 367 |
| Sullivan | 9 | 271.2% | 446.2% | 58 |
| Complied by the Marcellus Shale Coalition | ||||
Legislators always talk about creating jobs, but government does not create jobs or economic prosperity, it only redistributes the revenue it collects. It’s ironic that the one industry that is arguably doing the most to create jobs and increase state revenue is the only industry threatened with a new tax impact fee to finance other industries.