Media
SAT Scores by State, 2011
EDITORS NOTE: Click here for the 2014 SAT Scores by state

Every year, the College Board puts out SAT scores by state, but only in PDF format. Since the state comparisons are very popular, we compile that information, and I have posted it below.
The original SAT data is available from the College Board site, including their Pennsylvania SAT profile.
The College Board also reports that only 43 percent of SAT takers are college ready. This measure is of students who are likely to earn a B-minus average in college (keep in mind that not all students take the SAT, typically only college-bound students). This data is not broken down by state, but represents a combined score on reading, math and writing of 1550. By comparison, the median score in Pennsylvania was 1460—meaning most of our college-bound high school graduates aren’t academically prepared.
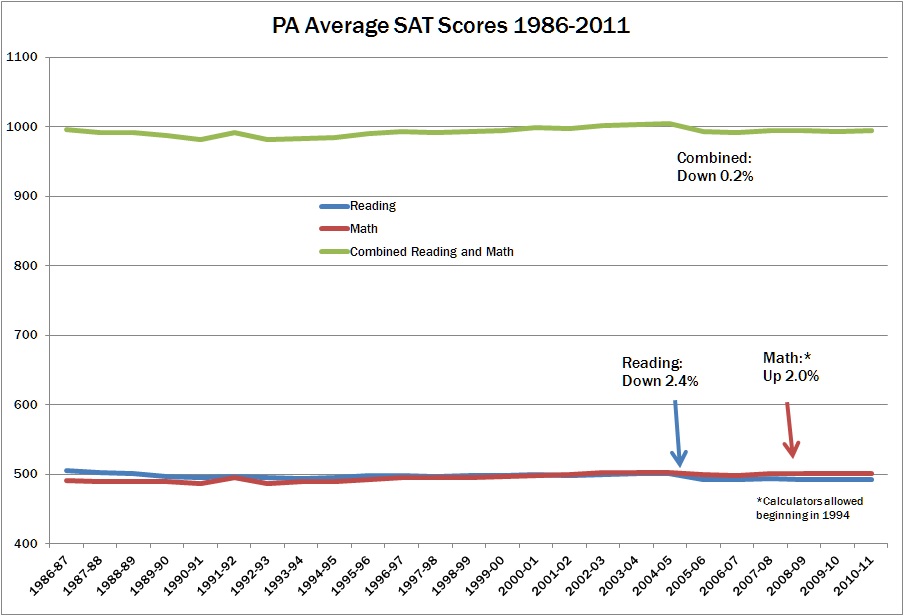
It should also be noted that despite dramatic increases in education spending, SAT scores have been flat in Pennsylvania for the past 25 years.
Editors Note: The original post read “By comparison, the average score in Pennsylvania was 1473—meaning most of our college-bound high school graduates aren’t academically prepared.” As a commenter pointed out, the average score does not show what “most students” do. However the median score, also provided by the College Board, at 1,460 for Pennsylvania does demonstrate that most students are not college ready. The post has been corrected for this fact.