Testimony
Growing Pennsylvania’s Economy
Testimony of Katrina M. Currie to Pennsylvania House Finance Committee, September 19, 2012
Good afternoon, my name is Katrina Currie; I am a policy analyst for the Commonwealth Foundation, Pennsylvania’s free-market think tank based here in Harrisburg. I wish to thank Chairman Benninghoff and Chairman Mundy and the members of the committee for the opportunity to testify today.
While today’s hearing focuses on four bills before this committee, they each fit into the broader discussion of government-directed “economic development” and targeted tax incentives. So I would like to begin with some perspective on this, before commenting on bill specifics.
The 19th century French economist Frederic Bastiat came up with a famous paradigm known as the “Broken Window Fallacy.” In this story, a young hoodlum throws a brick through a shopkeeper’s window. A crowd gathers, and someone begins to explain why the broken window is a good thing—the shopkeeper will have to buy a new glass window, creating work for a glassmaker, and pay someone to install the new window. Of course, this is only the seen effect. The unseen impact is the opportunity lost, because the shopkeeper has to use money he would have spent elsewhere (to hire a new employee, to expand his business, etc.) to pay for the now-broken window.
This concept applies to the proposed manufacturing and renewable energy tax credits. While jobs tied to tax credits are showcased, the effects of distorting the market and playing favorites are not immediately seen. But these costs outweigh any benefits.
Pennsylvania’s corporate income tax of 9.99 percent is the highest flat rate among all 50 states (this on top of the U.S. corporate tax rate, which is now the highest in the industrialized world). A Tax Foundation analysis finds Pennsylvania has the highest business tax cost for mature firms, and is second-worst for new companies, behind Hawaii.
The Made in Pennsylvania bills attempt to alleviate this tax burden and make Pennsylvania a more attractive place for businesses investment. These tax credits benefit a select group of manufacturers, tourism providers and renewable energy companies, but they fail to improve the economic climate for thousands of existing businesses, large and small, or for companies or entrepreneurs in other fields looking to start or expand in the commonwealth.
Targeted tax breaks and corporate welfare subsidies prevent across-the-board tax rate reductions that would benefit all Pennsylvanians—thereby attracting new businesses from all sectors, and allowing existing businesses to expand in Pennsylvania. The elimination of targeted economic development programs and reduction in overall tax rates would do more to encourage job growth and investment in the Keystone State than the proposed bills before the committee today.
As Table 1 illustrates, over the last six years, the commonwealth out-spent every state in the country on “economic development,” according to data collected by the Council for Community and Economic Research. However, there is no evidence states utilizing more direct subsidies and tax credits better stimulated their economies. From 2002 to 2012, the top 10 states—which spent the most on economic development—actually experienced worse job growth than the bottom 10 spending states.
| Table 1. Expenditures on Economic Development Programs | |||
| Top Ten States | |||
| States | Total FY 2007-12 | Per-Capita | Job Growth FY 2002-12 |
| Pennsylvania | $4,293,743,000 | $337 | 0.43% |
| California | $3,988,431,000 | $106 | -2.28% |
| Ohio | $3,899,052,173 | $338 | -5.63% |
| Virginia | $2,919,261,464 | $361 | 5.59% |
| Florida | $2,704,340,866 | $142 | -1.19% |
| Louisiana | $2,322,675,818 | $508 | 1.16% |
| New Jersey | $2,244,215,000 | $254 | -2.28% |
| Arkansas | $1,985,194,000 | $676 | 0.36% |
| Texas | $1,832,358,565 | $71 | 12.06% |
| New York | $1,678,794,570 | $86 | 2.93% |
| Average | 1.12% | ||
| Bottom Ten States | |||
| States | Total FY 2007-12 | Per-Capita | Job Growth FY 2002-12 |
| North Dakota | $319,637,895 | $467 | 19.67% |
| Maine | $300,089,883 | $226 | -0.54% |
| New Mexico | $289,734,600 | $139 | 2.59% |
| Delaware | $251,711,840 | $277 | 0.99% |
| Rhode Island | $235,031,721 | $224 | -6.40% |
| Nebraska | $185,454,042 | $101 | 4.14% |
| New Hampshire | $182,599,677 | $139 | 0.76% |
| Vermont | $156,422,080 | $250 | -1.71% |
| Idaho | $146,796,200 | $93 | 7.17% |
| Montana | $140,482,437 | $141 | 9.16% |
| Average | 3.58% | ||
| Source: State Economic Development Expenditure Database, The Council for Community and Economic Research (http://c2er.org); U.S. Bureau of Labor Statistics. | |||
While some of the effects of favoritism are unseen, there are numerous visible instances where Pennsylvania taxpayer-funded grants and subsidies have failed to create long-term jobs, including:
- Under Bob Casey Sr., Pennsylvania gave Sony $40 million to come to Westmoreland County, Pa which lasted about 15 years. The state, under Gov. Rendell, gave them $1 million to stay. That lasted about one year. The plant is now in Mexico.
- Lazarus Department Store in Pittsburgh received local taxpayer funding, beforeclosing down a few years later.In a similar case, Kolovani’s and Company in Lebanontook state money over a few years.
- Amazon.com got state funding to build a distribution center in Hazleton. They subsequentlyclosed a distribution center in Chambersburg, leaving the state with almost no net gain.
- Anaudit of Pennsylvania’s Opportunity Grant Programfound numerous cases of companies receiving grants and loans, yet going out of business without creating the promised jobs. These include $900,000 to AcceLight and $250,000 to Laclede Steel.
- Harley Davidson got $4 million in 2000 to stay in Pennsylvania “forever.” The companyagain threatened to leave in 2009,and got $15 million in taxpayer money, while cutting its workforce in half.
- Finally, the Pittsburgh Penguins threatened to leave, got millions for a new arena, and afterwards owner Mario Lemieux notedthere was no risk the team would have left.
These examples are supported by the 2010 Legislative Budget and Finance Committee report on Pennsylvania’s tax credit programs, which found very little was done to actually monitor job creation stemming from companies receiving tax credits. Companies failed to submit required documentation, or failed to meet program requirements in documentation submitted. In turn, DCED never verified documentation was accurate, and there exists little hard evidence that jobs promised as a result of government intervention were ever created.
Here is a glance at the report’s evaluation of Pennsylvania’s Job Creation Tax Credit:
- Employment affidavits were missing 51 percent of the time;
- Several companies never provided base jobs information;
- Nearly half of the companies never provided new employee wage information to show they met the hourly wage requirement;
- None of the files reviewed provided evidence that new jobs weren’t created before the receiving the credits; and
- None of the cases reviewed provided evidence that jobs didn’t move from one municipality to another.
Of the 26 files reviewed that allowed the committee to compare jobs committed versus actually created, the report stated:
- Ten employers exceeded their employment goals;
- Seven created no jobs;
- Eight did not meet their employment goals;
- One employer lost jobs below its base rate;
- Overall, actual jobs created were 25 percent below the number committed by these firms.
The report’s conclusion on the effectiveness of tax credits notes, “In general, scholars suggest the tax incentives have had mixed results, and tend to benefit persons and businesses in high tax brackets most and are difficult to administer.” It further stated that some scholars believe that job creation tax credits are ineffective, lead to businesses’ gaming the system, and provide little evidence that they would not have hired new employees without the credit.
The proposed legislative package under discussion today would face the same shortcomings, as DCED would be left to promulgate its own rules to regulate and implement the programs.
The proposed bills are narrowly targeted to benefit a special few companies and utilize the tax code to dictate business practices in ways that would benefit some employers, but would likely hamper economic growth. Moreover, HB 2181 unwisely allows for the automatic approval of a tax credit for a manufacturer if DCED fails to respond to the business’ application within 30 days.
Two of the bills in the package—HB 2183 and HB 2184—are targeted at creating renewable energy jobs. There is already substantial taxpayer support for renewable energy creation in the state. Briefly examining these incentives serves as an excellent case study for why targeted incentives don’t work for the benefit of all Pennsylvanians.
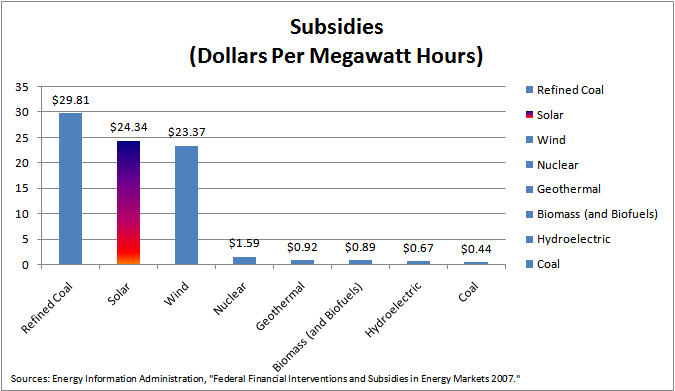
First, renewable energy is already heavily subsidized. According to the Federal Energy Information Administration, solar energy producers receive 55 times more in federal subsidies per megawatt hour than coal, and 95 times more than natural gas. This does not include the more than $2 billion Pennsylvania has authorized in alternative energy subsidies since 1999.
Second, on top of subsidies and tax breaks, the commonwealth mandates that utility companies use renewable energy. Pennsylvania is one of 29 states (as well as the District of Columbia and Puerto Rico) that has a renewable energy standard. Pennsylvania calls it an “Alternative Energy Portfolio Standard.” These mandates force utility companies to produce a percentage of their electricity from renewable energy sources, such as wind and solar.
Comparing states with and without these mandates, a report by the Manhattan Institute found:
- In 2010, residents in states with renewable energy mandates on average experienced electricity prices 31.9 percent higher than in non-mandated states. Similarly, commercial rates were 27.4 percent higher, and industrial rates were 30.7 percent higher.
- Of the ten states with the highest electricity prices, eight have RPS mandates: Hawaii, Connecticut, New York, New Jersey, New Hampshire, Rhode Island, Maine, and California.
- Of the 10 states with the lowest electricity prices, only two have RPS mandates. They are Washington and Oregon.
Finally, forcing alternative energy use actually reduces job growth by raising electricity prices. A study by Penn State scholars found Pennsylvania’s alternative energy mandates will cost taxpayers up to $60 million next year and up to $440 million in ten years. Twenty-five to 30 percent of this price tag stems from meeting the state’s solar requirements. According to the Pennsylvania Public Utility Commission, Pennsylvania solar energy is 10 times more expensive than electricity from natural gas.
Mandates and subsidies may “create” jobs in certain industries, but are actually a net drain on jobs overall. Higher electricity prices hurt businesses-the same manufacturing and tourism companies this legislation is seeking to help—resulting in fewer jobs.
Rather than tax breaks to stimulate job growth in targeted industries, economic development policy should focus on making the state more attractive for all businesses and for entrepreneurs through the elimination of all targeted economic development programs and reduction and overall tax rates . Instead of expanding tax breaks for renewable energy, the state should repeal its alternative energy mandate, lowering energy prices for companies and residents throughout the commonwealth.
I thank you for the opportunity to testify today, and welcome your questions.